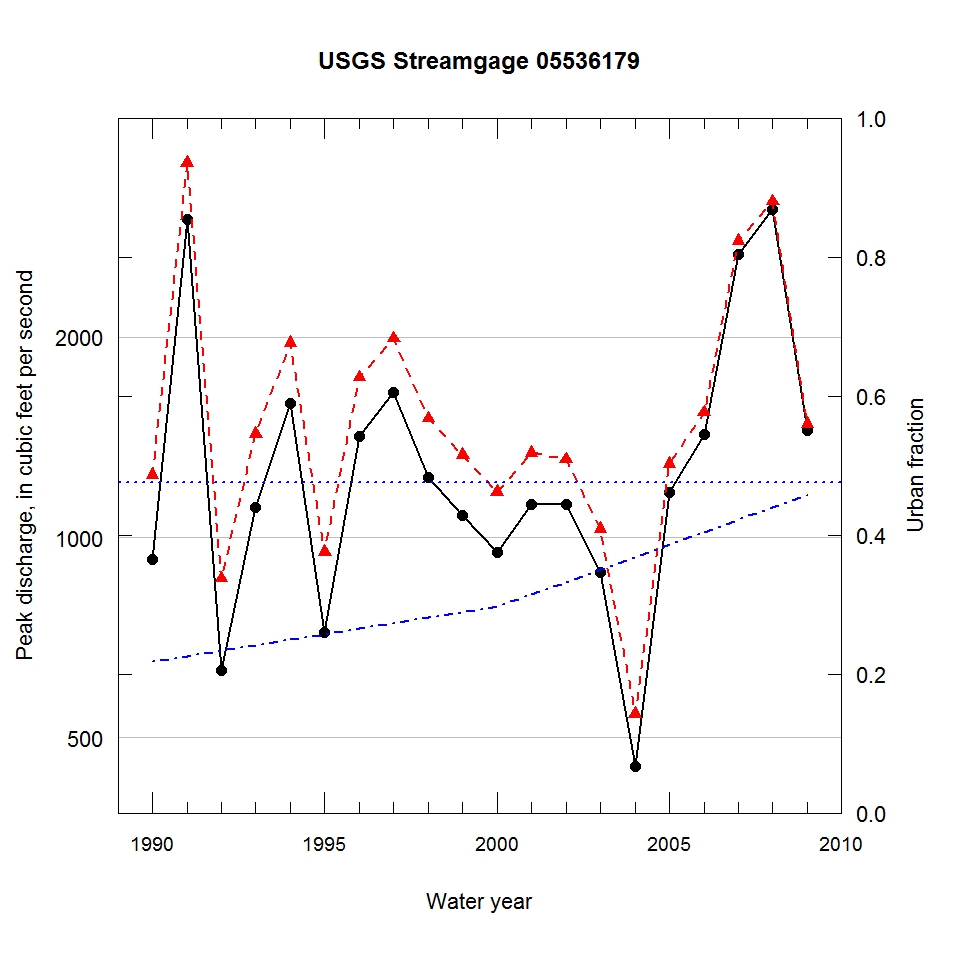
Observed and urbanization-adjusted annual maximum peak discharge and associated urban fraction and precipitation values at USGS streamgage:
05536179 HART DITCH AT DYER, IN


| Water year | Segment | Discharge code | Cumulative reservoir storage (acre-feet) | Urban fraction | Precipitation (inches) | Observed peak discharge (ft3/s) | Adjusted peak discharge (ft3/s) | Exceedance probability |
| 1990 | 1 | -- | 0 | 0.218 | 1.569 | 927 | 1240 | 0.526 |
| 1991 | 1 | -- | 0 | 0.226 | 3.016 | 3010 | 3650 | 0.023 |
| 1992 | 1 | E | 0 | 0.234 | 0.532 | 631 | 868 | 0.775 |
| 1993 | 1 | -- | 0 | 0.242 | 1.853 | 1110 | 1430 | 0.408 |
| 1994 | 1 | -- | 0 | 0.250 | 0.981 | 1590 | 1960 | 0.181 |
| 1995 | 1 | E | 0 | 0.257 | 1.021 | 721 | 950 | 0.725 |
| 1996 | 1 | -- | 0 | 0.265 | 3.328 | 1420 | 1740 | 0.252 |
| 1997 | 1 | -- | 0 | 0.273 | 2.058 | 1650 | 1990 | 0.175 |
| 1998 | 1 | -- | 0 | 0.281 | 1.845 | 1230 | 1510 | 0.364 |
| 1999 | 1 | -- | 0 | 0.289 | 0.607 | 1080 | 1330 | 0.469 |
| 2000 | 1 | -- | 0 | 0.297 | 1.290 | 950 | 1170 | 0.578 |
| 2001 | 1 | -- | 0 | 0.315 | 0.692 | 1120 | 1340 | 0.463 |
| 2002 | 1 | -- | 0 | 0.332 | 1.680 | 1120 | 1310 | 0.478 |
| 2003 | 1 | -- | 0 | 0.350 | 1.242 | 887 | 1030 | 0.669 |
| 2004 | 1 | -- | 0 | 0.368 | 0.880 | 453 | 543 | 0.932 |
| 2005 | 1 | -- | 0 | 0.386 | 1.173 | 1170 | 1290 | 0.491 |
| 2006 | 1 | -- | 0 | 0.404 | 3.231 | 1430 | 1540 | 0.346 |
| 2007 | 1 | -- | 0 | 0.422 | 2.010 | 2660 | 2790 | 0.058 |
| 2008 | 1 | -- | 0 | 0.440 | 4.328 | 3110 | 3200 | 0.038 |
| 2009 | 1 | -- | 0 | 0.457 | 1.171 | 1450 | 1480 | 0.381 |

